
 A Oneindia Venture


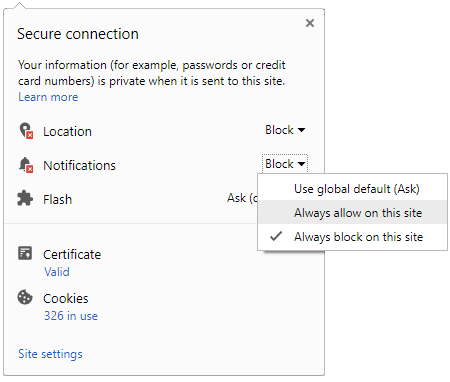
 Click it and Unblock the Notifications
Mirae Asset Flexi Cap Fund
3 Year Absolute Returns
35.64% ↑
NAV (₹) on 30 Oct 2026
15.52
1 Day NAV Change
-0.19%
Risk Level
Very High Risk
Rating
Mirae Asset Flexi Cap Fund is a Equity mutual fund categorized under Diversified, offered by Mirae Asset Global Investments (India) Pvt. Ltd.. Launched on 03 Feb 2023, investors can start with a ... Read more
NAV History
Fund Details
Returns Calculator
Asset Allocation
AUM
₹ 4,368.94 Cr
Sector Holdings
| Sectors | Weightage |
|---|---|
| Finance - Banks - Private Sector | 13.76% |
| Pharmaceuticals | 7.04% |
| IT Consulting & Software | 5.10% |
| Refineries | 4.50% |
| Non-Banking Financial Company (NBFC) | 4.28% |
| Exchange Platform | 4.03% |
| Finance - Life Insurance | 3.41% |
| Auto - Cars & Jeeps | 2.63% |
| Power - Generation/Distribution | 2.59% |
| Realty | 2.47% |
| Finance - Banks - Public Sector | 2.44% |
| Gems, Jewellery & Precious Metals | 2.19% |
| Telecom Services | 2.09% |
| Hospitals & Medical Services | 2.00% |
| E-Commerce/E-Retail | 1.95% |
| Construction, Contracting & Engineering | 1.95% |
| Engineering - General | 1.83% |
| Cement | 1.74% |
| Lenses/Optical Care | 1.72% |
| Aerospace & Defense | 1.69% |
| Telecom Equipment | 1.61% |
| Hotels, Resorts & Restaurants | 1.60% |
| Electric Equipment - General | 1.49% |
| Finance - Mutual Funds | 1.48% |
| Port & Port Services | 1.46% |
| Auto Ancl - Others | 1.31% |
| Chemicals - Organic - Others | 1.30% |
| Auto - 2 & 3 Wheelers | 1.28% |
| Consumer Electronics | 1.09% |
| Steel - Sponge Iron | 1.04% |
| Textiles - General | 1.02% |
| Engines | 1.01% |
| IT Enabled Services | 1.00% |
| Textiles - Spinning - Cotton Blended | 0.99% |
| Retail - Apparel/Accessories | 0.98% |
| Food Processing & Packaging | 0.94% |
| Services - Others | 0.90% |
| Cigarettes & Tobacco Products | 0.86% |
| Finance & Investments | 0.84% |
| Bearings | 0.83% |
| Aluminium | 0.82% |
| Mining/Minerals | 0.78% |
| Cables - Power/Others | 0.63% |
| Tea & Coffee | 0.61% |
| Iron & Steel | 0.60% |
| Oil Drilling And Exploration | 0.60% |
| Chemicals - Others | 0.57% |
| Airlines | 0.44% |
| Packaging & Containers | 0.43% |
| Power - Transmission/Equipment | 0.38% |
| Amusement Parks/Recreation | 0.38% |
| Ceramics/Tiles/Sanitaryware | 0.32% |
| Plywood/Laminates | 0.29% |
| Finance - Housing | 0.25% |
| Treps/Reverse Repo | 0.22% |
| Chemicals - Speciality | 0.16% |
| Net Receivables/(Payables) | 0.10% |
| Industrial Explosives | 0.02% |
| Electric Equipment - Transformers | 0.01% |
Stock Holdings
| Name | Weightage | Value (in Cr.) | Sector |
|---|---|---|---|
| ICICI Bank Ltd. | 5.38% | ₹ 235 | Finance - Banks - Private Sector |
| HDFC Bank Ltd. | 5.37% | ₹ 234.51 | Finance - Banks - Private Sector |
| Reliance Industries Ltd. | 3.79% | ₹ 165.73 | Refineries |
| State Bank of India | 2.44% | ₹ 106.68 | Finance - Banks - Public Sector |
| Axis Bank Ltd. | 2.29% | ₹ 99.92 | Finance - Banks - Private Sector |
| Bharti Airtel Ltd. | 2.09% | ₹ 91.42 | Telecom Services |
| Larsen & Toubro Ltd. | 1.95% | ₹ 85.35 | Construction, Contracting & Engineering |
| Mahindra & Mahindra Ltd. | 1.81% | ₹ 79.26 | Auto - Cars & Jeeps |
| Lenskart Solutions Ltd. | 1.72% | ₹ 75.08 | Lenses/Optical Care |
| Multi Commodity Exchange of India Ltd. | 1.68% | ₹ 73.27 | Exchange Platform |
| The Phoenix Mills Ltd. | 1.62% | ₹ 70.63 | Realty |
| Indus Towers Ltd. | 1.61% | ₹ 70.24 | Telecom Equipment |
| Engineers India Ltd. | 1.51% | ₹ 65.82 | Engineering - General |
| CG Power and Industrial Solutions Ltd. | 1.49% | ₹ 64.92 | Electric Equipment - General |
| ICICI Prudential Asset Management Company Ltd. | 1.48% | ₹ 64.47 | Finance - Mutual Funds |
| Mankind Pharma Ltd. | 1.47% | ₹ 64.44 | Pharmaceuticals |
| L&T Finance Ltd. | 1.46% | ₹ 63.60 | Non-Banking Financial Company (NBFC) |
| Adani Ports and Special Economic Zone Ltd. | 1.46% | ₹ 63.84 | Port & Port Services |
| Tata Consultancy Services Ltd. | 1.45% | ₹ 63.29 | IT Consulting & Software |
| NLC India Ltd. | 1.44% | ₹ 62.76 | Power - Generation/Distribution |
| Lupin Ltd. | 1.43% | ₹ 62.56 | Pharmaceuticals |
| Infosys Ltd. | 1.42% | ₹ 61.95 | IT Consulting & Software |
| SBI Life Insurance Co. Ltd. | 1.38% | ₹ 60.22 | Finance - Life Insurance |
| Tenneco Clean Air India Ltd. | 1.31% | ₹ 57.30 | Auto Ancl - Others |
| Foseco India Ltd. | 1.30% | ₹ 57.01 | Chemicals - Organic - Others |
| TVS Motor Company Ltd. | 1.28% | ₹ 55.84 | Auto - 2 & 3 Wheelers |
| BlueStone Jewellery & Lifestyle Ltd. | 1.27% | ₹ 55.37 | Gems, Jewellery & Precious Metals |
| BSE Ltd. | 1.24% | ₹ 54.11 | Exchange Platform |
| Tech Mahindra Ltd. | 1.20% | ₹ 52.43 | IT Consulting & Software |
| Eternal Ltd. | 1.15% | ₹ 50.24 | E-Commerce/E-Retail |
| JSW Energy Ltd. | 1.15% | ₹ 50.17 | Power - Generation/Distribution |
| Anthem Biosciences Ltd. | 1.15% | ₹ 50.10 | Pharmaceuticals |
| Ultratech Cement Ltd. | 1.13% | ₹ 49.30 | Cement |
| National Stock Exchange of India Ltd. | 1.11% | ₹ 48.37 | Exchange Platform |
| Bajaj Finance Ltd. | 1.10% | ₹ 47.96 | Non-Banking Financial Company (NBFC) |
| LG Electronics India Ltd. | 1.09% | ₹ 47.62 | Consumer Electronics |
| Canara HSBC Life Insurance Co.Ltd. | 1.05% | ₹ 45.88 | Finance - Life Insurance |
| Molbio Diagnostics Ltd. | 1.05% | ₹ 45.81 | Hospitals & Medical Services |
| Divi's Laboratories Ltd. | 1.04% | ₹ 45.53 | Pharmaceuticals |
| Jindal Steel Ltd. | 1.04% | ₹ 45.41 | Steel - Sponge Iron |
| Billionbrains Garage Ventures Ltd. | 1.03% | ₹ 45.01 | IT Consulting & Software |
| Kusumgar Ltd. | 1.02% | ₹ 44.59 | Textiles - General |
| Cummins India Ltd. | 1.01% | ₹ 43.91 | Engines |
| Inventurus Knowledge Solutions Ltd. | 1.00% | ₹ 43.67 | IT Enabled Services |
| K.P.R. Mill Ltd. | 0.99% | ₹ 43.36 | Textiles - Spinning - Cotton Blended |
| Life Insurance Corporation of India | 0.98% | ₹ 42.68 | Finance - Life Insurance |
| Trent Ltd. | 0.98% | ₹ 42.99 | Retail - Apparel/Accessories |
| Devyani International Ltd. | 0.98% | ₹ 42.66 | Hotels, Resorts & Restaurants |
| Narayana Hrudayalaya Ltd. | 0.95% | ₹ 41.50 | Hospitals & Medical Services |
| Britannia Industries Ltd. | 0.94% | ₹ 41.01 | Food Processing & Packaging |
| Titan Company Ltd. | 0.92% | ₹ 40.37 | Gems, Jewellery & Precious Metals |
| Central Depository Services (I) Ltd. | 0.90% | ₹ 39.18 | Services - Others |
| Shriram Finance Ltd. | 0.89% | ₹ 38.82 | Non-Banking Financial Company (NBFC) |
| Hindustan Aeronautics Ltd. | 0.89% | ₹ 38.74 | Aerospace & Defense |
| ITC Ltd. | 0.86% | ₹ 37.77 | Cigarettes & Tobacco Products |
| DLF Ltd. | 0.85% | ₹ 37.07 | Realty |
| Cholamandalam Financial Holdings Ltd. | 0.84% | ₹ 36.54 | Finance & Investments |
| Sundaram Finance Ltd. | 0.83% | ₹ 36.13 | Non-Banking Financial Company (NBFC) |
| Schaeffler India Ltd. | 0.83% | ₹ 36.05 | Bearings |
| Maruti Suzuki India Ltd. | 0.82% | ₹ 35.90 | Auto - Cars & Jeeps |
| Vedanta Aluminium Metal Ltd. | 0.82% | ₹ 35.82 | Aluminium |
| Bharat Electronics Ltd. | 0.80% | ₹ 34.95 | Aerospace & Defense |
| Shiprocket Ltd. | 0.80% | ₹ 35.17 | E-Commerce/E-Retail |
| Vedanta Ltd. | 0.78% | ₹ 33.93 | Mining/Minerals |
| Kotak Mahindra Bank Ltd. | 0.72% | ₹ 31.48 | Finance - Banks - Private Sector |
| Bharat Petroleum Corporation Ltd. | 0.71% | ₹ 30.84 | Refineries |
| Sai Life Sciences Ltd. | 0.69% | ₹ 30.23 | Pharmaceuticals |
| Symbiotec Pharmalab Ltd | 0.67% | ₹ 29.14 | Pharmaceuticals |
| Motherson Sumi Wiring India Ltd. | 0.63% | ₹ 27.70 | Cables - Power/Others |
| The Indian Hotels Company Ltd. | 0.62% | ₹ 26.92 | Hotels, Resorts & Restaurants |
| JK Cement Ltd. | 0.61% | ₹ 26.68 | Cement |
| Tata Consumer Products Ltd. | 0.61% | ₹ 26.63 | Tea & Coffee |
| Steel Authority of India Ltd. | 0.60% | ₹ 26.32 | Iron & Steel |
| Oil & Natural Gas Corporation Ltd. | 0.60% | ₹ 26.19 | Oil Drilling And Exploration |
| Sun Pharmaceutical Industries Ltd. | 0.59% | ₹ 25.98 | Pharmaceuticals |
| SRF Ltd. | 0.57% | ₹ 24.73 | Chemicals - Others |
| Interglobe Aviation Ltd. | 0.44% | ₹ 19.29 | Airlines |
| Safari Industries (India) Ltd. | 0.43% | ₹ 18.77 | Packaging & Containers |
| Voltamp Transformers Ltd. | 0.38% | ₹ 16.61 | Power - Transmission/Equipment |
| Wonderla Holidays Ltd. | 0.38% | ₹ 16.43 | Amusement Parks/Recreation |
| Cera Sanitaryware Ltd. | 0.32% | ₹ 13.93 | Ceramics/Tiles/Sanitaryware |
| INDO-MIM Ltd. | 0.32% | ₹ 13.88 | Engineering - General |
| Century Plyboards (India) Ltd. | 0.29% | ₹ 12.74 | Plywood/Laminates |
| Can Fin Homes Ltd. | 0.25% | ₹ 10.82 | Finance - Housing |
| TREPS | 0.22% | ₹ 9.81 | Others |
| Pidilite Industries Ltd. | 0.16% | ₹ 6.85 | Chemicals - Speciality |
| Net Receivables / (Payables) | 0.10% | ₹ 4.52 | Others |
| Solar Industries India Ltd. | 0.02% | ₹ 0.98 | Industrial Explosives |
| Kanohar Electricals Ltd. | 0.01% | ₹ 0.29 | Electric Equipment - Transformers |
Returns
| Annualised returns | ||||
|---|---|---|---|---|
| 9M | 1Y | 2Y | 3Y | |
| Fund returns | -3.35% | -4.57% | 1.73% | 10.70% |
| Category returns | 0.29% | -3.31% | 0.66% | 34.11% |
Fund Objective
The investment objective of the scheme is to provide long-term capital appreciation from a portfolio investing predominantly in Indian equity and equity related instruments across market ... Read more
AMC Details
Top Funds from Equity - Flexi Cap
|
Scheme Name
|
NAV
|
Returns
1Y
3Y
5Y
|
AUM (Cr)
|
Expense Ratio
|
Risk Meter
|
||
|---|---|---|---|---|---|---|---|
|
ITI Flexi Cap Fund - Direct Plan
Diversified
Direct
|
₹20.35 | 6.40% | 65.63% | 0.00% | ₹1,588 | 0.91% |
Very High
|
|
Bank of India Flexi Cap Fund - Direct Plan
Diversified
Direct
|
₹40.10 | 1.91% | 64.95% | 101.20% | ₹3,098 | 0.85% |
Very High
|
|
Bank of India Flexi Cap Fund - Direct Plan
Diversified
Direct
|
₹34.27 | 1.90% | 64.92% | 101.12% | ₹3,098 | 0.85% |
Very High
|
|
Bank of India Flexi Cap Fund - Direct Plan
Diversified
Direct
|
₹34.27 | 1.90% | 64.92% | 101.12% | ₹3,098 | 0.85% |
Very High
|
|
ITI Flexi Cap Fund - Direct Plan
Diversified
Direct
|
₹19.71 | 3.06% | 60.43% | 0.00% | ₹1,588 | 0.91% |
Very High
|
|
ITI Flexi Cap Fund - Direct Plan
Diversified
Direct
|
₹19.71 | 3.06% | 60.43% | 0.00% | ₹1,588 | 0.91% |
Very High
|
|
Motilal Oswal Flexi Cap Fund - Direct Plan
Diversified
Direct
|
₹67.61 | -3.83% | 59.50% | 79.88% | ₹13,446 | 1.22% |
Very High
|
|
360 ONE Flexi Cap Fund - Direct Plan
Diversified
Direct
|
₹16.34 | 1.77% | 58.89% | 0.00% | ₹2,246 | 0.92% |
Very High
|
|
360 ONE Flexi Cap Fund - Direct Plan
Diversified
Direct
|
₹16.34 | 1.77% | 58.89% | 0.00% | ₹2,246 | 0.92% |
Very High
|
|
360 ONE Flexi Cap Fund - Direct Plan
Diversified
Direct
|
₹16.34 | 1.77% | 58.89% | 0.00% | ₹2,246 | 0.92% |
Very High
|
Top Funds from Mirae Asset Global Investments (India) Pvt. Ltd.
|
Scheme Name
|
NAV
|
Returns
1Y
3Y
5Y
|
AUM (Cr)
|
Expense Ratio
|
Risk Meter
|
||
|---|---|---|---|---|---|---|---|
|
Mirae Asset NYSE FANG + ETF Fund of Fund - Direct Plan
Fund of Funds
Direct
|
₹48.53 | 28.65% | 280.57% | 297.88% | ₹3,085 | 0.04% |
Very High
|
|
Mirae Asset NYSE FANG + ETF Fund of Fund
Fund of Funds
Regular
|
₹47.51 | 28.17% | 276.19% | 290.41% | ₹3,085 | 0.41% |
Very High
|
|
Mirae Asset S&P 500 Top 50 ETF Fund of Fund - Direct Plan
Fund of Funds
Direct
|
₹34.86 | 36.75% | 215.25% | 229.31% | ₹1,031 | 0.04% |
Very High
|
|
Mirae Asset S&P 500 Top 50 ETF Fund of Fund
Fund of Funds
Regular
|
₹34.14 | 36.22% | 211.51% | 222.73% | ₹1,031 | 0.42% |
Very High
|
|
Mirae Asset NYSE FANG + ETF
ETF
Regular
|
₹164.13 | 11.76% | 173.67% | 183.28% | ₹4,448 | 0.66% |
Very High
|
|
Mirae Asset Global X Artificial Intelligence & Technology...
Fund of Funds
Direct
|
₹33.63 | 22.47% | 163.47% | 0.00% | ₹486 | 0.11% |
Very High
|
|
Mirae Asset Global X Artificial Intelligence & Technology...
Fund of Funds
Regular
|
₹33.41 | 22.31% | 162.35% | 0.00% | ₹486 | 0.26% |
Very High
|
|
Mirae Asset Silver ETF
ETF
Regular
|
₹176.89 | 23.75% | 146.04% | 0.00% | ₹1,173 | 0.35% |
Very High
|
|
Mirae Asset Gold ETF
ETF
Regular
|
₹135.41 | 15.82% | 122.34% | 0.00% | ₹3,470 | 0.35% |
High
|
|
Mirae Asset S&P 500 Top 50 ETF
ETF
Regular
|
₹65.64 | 10.75% | 111.02% | 120.77% | ₹1,154 | 0.65% |
Very High
|
FAQs
What is the current NAV of Mirae Asset Flexi Cap Fund Regular Growth?
What is the fund size (AUM) of Mirae Asset Flexi Cap Fund Regular Growth?
What are the historical returns of Mirae Asset Flexi Cap Fund Regular Growth?
What is the risk level of Mirae Asset Flexi Cap Fund Regular Growth?
What is the minimum investment amount for Mirae Asset Flexi Cap Fund Regular Growth?
Disclaimer: This is 3rd Party content/feed, viewers are requested to use their discretion and conduct proper diligence before investing, GoodReturns does not take any liability on the genuineness and correctness of the information in this article
-
Block for 8 hours
-
Block for 12 hours
-
Block for 24 hours
-
Don't block

 Sign in with Google
- Male
- Female
- Others
- Under 18
- 18 to 25
- 26 to 35
- 36 to 45
- 45 to 55
- 55+