



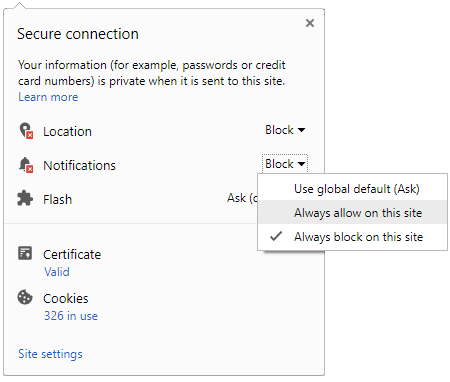
 Click it and Unblock the Notifications
Frax (prev. FXS) Price Today in India
Frax (prev. FXS) (FRAX) is trading at Rs.18.59 (about $0.1989) as of November 19, 2026, up 1.84% over the last 24 hours. It is ranked #551 by market capitalisation, with a market cap of Rs.213.72 Cr. Its trading volume over the last 24 hours is Rs.3.33 Cr. Over the last 10 days the price has moved from Rs.21.08 to Rs.18.59, ranging between Rs.17.85 and Rs.21.35. Across the last 52 weeks FRAX has traded between a low of Rs.17.85 and a high of Rs.112.17. Frax (prev. FXS) has a circulating supply of 114.98M FRAX and no fixed maximum supply.

Frax (prev. FXS) Price Chart
Frax (prev. FXS) Performance
| Period | 1 Hour | 24 Hours | 7 Days | 30 Days | 1 Year |
|---|---|---|---|---|---|
| Change | +0.22% | +1.84% | -11.81% | -23.94% | -78.73% |
| Value then | ₹18.55 | ₹18.25 | ₹21.08 | ₹24.44 | ₹87.39 |
FRAX Converter
Frax (prev. FXS) Price History
| Date | Price (INR) | Price (USD) | Change |
|---|---|---|---|
| 19 Nov 2026 | ₹18.59 | $0.1989 | ▲ +0.70% |
| 18 Nov 2026 | ₹18.46 | $0.1975 | ▲ +3.44% |
| 17 Nov 2026 | ₹17.85 | $0.1909 | ▼ -9.41% |
| 16 Nov 2026 | ₹19.70 | $0.2098 | ▼ -3.23% |
| 15 Nov 2026 | ₹20.36 | $0.2160 | ▲ +2.34% |
| 14 Nov 2026 | ₹19.89 | $0.2110 | ▼ -2.36% |
| 13 Nov 2026 | ₹20.37 | $0.2161 | ▼ -1.84% |
| 12 Nov 2026 | ₹20.75 | $0.2206 | ▼ -2.81% |
| 11 Nov 2026 | ₹21.35 | $0.2276 | ▲ +1.30% |
| 10 Nov 2026 | ₹21.08 | $0.2249 | ▼ -3.20% |
FAQs
What is the price of Frax (prev. FXS) (FRAX) today?
As of November 19, 2026, the price of Frax (prev. FXS) (FRAX) in India is Rs.18.59 (about $0.1989). Over the last 24 hours FRAX is up 1.84%.What is the 24-hour high and low of Frax (prev. FXS)?
In the last 24 hours Frax (prev. FXS) has traded between a low of Rs.18.19 ($0.1946) and a high of Rs.18.88 ($0.2021). At Rs.18.59, the current price sits around the middle of that range.What is the highest and lowest price of Frax (prev. FXS) in the last 52 weeks?
Between November 20, 2025 and November 19, 2026, Frax (prev. FXS) recorded a high of Rs.112.17 ($1.24) on January 19, 2026 and a low of Rs.17.85 ($0.1909) on November 17, 2026. The current price of Rs.18.59 is 83.43% below that high and 4.16% above that low.How has the Frax (prev. FXS) price moved over the last 10 days?
Over the last 10 days (November 10, 2026 to November 19, 2026) Frax (prev. FXS) moved from Rs.21.08 to Rs.18.59, a decline of 11.82%. The price ranged between a low of Rs.17.85 and a high of Rs.21.35 over this period. It closed higher on 4 of the last 9 sessions.What is the market capitalisation of Frax (prev. FXS)?
Frax (prev. FXS) has a market capitalisation of Rs.213.72 Cr ($22.87M), which puts it at rank #551 among all cryptocurrencies tracked on GoodReturns. Its trading volume over the last 24 hours is Rs.3.33 Cr ($356,362).How much has Frax (prev. FXS) gained or lost over the last week, month and year?
Frax (prev. FXS) is down 11.81% over the last 7 days, down 23.94% over 30 days and down 78.73% over the last one year.How many Frax (prev. FXS) (FRAX) coins are in circulation?
Frax (prev. FXS) has a circulating supply of 114.98M FRAX and no fixed maximum supply.Disclaimer: Cryptocurrency is an unregulated digital asset class in India and prices are highly volatile. This is third-party content/data; viewers are requested to use their discretion and conduct proper diligence before investing. GoodReturns does not take any liability on the genuineness and correctness of the information presented here.

 Sign in with Google