



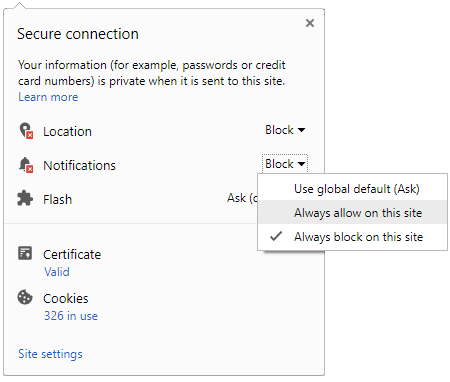
 Click it and Unblock the Notifications
The Graph Price Today in India
Track the live price of The Graph (GRT) in India, converted into Indian Rupees (INR), along with its 24-hour, 7-day, and 1-year performance, trading volume, and market capitalisation, updated regularly throughout the trading day. The Graph is a decentralised indexing protocol often described as 'Google for blockchains', allowing developers to efficiently query and retrieve blockchain data for use in decentralised applications. This page is designed to give you a complete, quick snapshot of how The Graph is trading right now- whether you already hold the coin and want to track your position, are researching it before making a purchase, or are simply comparing it against other cryptocurrencies listed on the broader market. Alongside the live price, you will find background on what The Graph is, how it works, its price history, how to buy it in India, and the main factors that tend to influence its price over time.

The Graph (GRT) is trading at Rs.1.59 (about $0.0169) as of November 12, 2026, down 4.19% over the last 24 hours. It is ranked #125 by market capitalisation, with a market cap of Rs.1.76K Cr. Its trading volume over the last 24 hours is Rs.132.81 Cr. Over the last 10 days the price has moved from Rs.1.83 to Rs.1.59, ranging between Rs.1.59 and Rs.1.94. Since February 15, 2026, GRT has traded between a low of Rs.1.26 and a high of Rs.3.01. The Graph has a circulating supply of 11.04B GRT and no fixed maximum supply.
The Graph Price Chart
The Graph Performance
| Period | 1 Hour | 24 Hours | 7 Days | 30 Days | 1 Year |
|---|---|---|---|---|---|
| Change | -0.72% | -4.19% | -16.62% | -33.79% | -74.79% |
| Value then | ₹1.60 | ₹1.66 | ₹1.91 | ₹2.40 | ₹6.31 |
GRT Converter
The Graph Price History
| Date | Price (INR) | Price (USD) | Change |
|---|---|---|---|
| 12 Nov 2026 | ₹1.59 | $0.0169 | ▼ -4.59% |
| 12 Nov 2026 | ₹1.67 | $0.0178 | ▼ -0.72% |
| 11 Nov 2026 | ₹1.68 | $0.0179 | ▲ +1.87% |
| 11 Nov 2026 | ₹1.65 | $0.0176 | ▼ -0.09% |
| 10 Nov 2026 | ₹1.65 | $0.0176 | ▼ -4.59% |
| 10 Nov 2026 | ₹1.73 | $0.0185 | ▲ +0.09% |
| 09 Nov 2026 | ₹1.73 | $0.0184 | ▼ -1.27% |
| 09 Nov 2026 | ₹1.75 | $0.0186 | ▲ +0.08% |
| 08 Nov 2026 | ₹1.75 | $0.0186 | ▼ -3.20% |
| 07 Nov 2026 | ₹1.81 | $0.0192 | ▼ -1.02% |
What Is The Graph (GRT)?
The Graph (GRT) is a cryptocurrency built around indexing and serving blockchain data to applications. Like most tokens in its category, it is issued and secured on a blockchain and can be bought, sold, and held through cryptocurrency exchanges, with its value tied to the level of adoption, usage, and trust in the network or platform it powers. Understanding what The Graph is designed to do can help put its price movements in context, since tokens tied to actively used networks or protocols tend to be influenced by real usage trends in addition to broader cryptocurrency market sentiment.
The Graph (GRT) Price Today in India
The live The Graph (GRT) price shown above is updated regularly throughout the day and reflects trading activity aggregated across major global cryptocurrency exchanges, converted into Indian Rupees at the prevailing USD/INR exchange rate. Refer to the 24H, 7D, and 1Y columns to see how the price has moved over each of those time frames, which can help you distinguish between short-term price swings and a more sustained longer-term trend. Trading volume and market capitalisation are shown alongside the price and can give you a sense of how actively The Graph is being traded and how it compares in size to other cryptocurrencies listed on this page. As with all cryptocurrencies, prices can move quickly, so it's worth checking back regularly if you're actively tracking The Graph rather than relying on a single snapshot in time.
The Graph (GRT) Price History and Performance
As an oracle and data-infrastructure token, The Graph (GRT)'s price has generally moved in relation to overall demand for reliable on-chain data across DeFi and other smart-contract applications, with periods of strength tied to growth in the sectors that rely on its data feeds.
How to Buy The Graph (GRT) in India?
The Graph (GRT) can be bought on major Indian crypto exchanges using Indian Rupees via UPI, IMPS or bank transfer after completing KYC verification, and held on the exchange or moved to a personal wallet, where it may also be used for staking or governance related to the oracle network's operation.
Key Factors That Influence the The Graph (GRT) Price
The Graph (GRT)'s price is influenced by the volume of applications and smart contracts relying on its data feeds, the breadth and reliability of the data sources it connects to blockchains, competition from other oracle providers, and overall crypto market sentiment.
FAQs
What is the price of The Graph (GRT) today?
As of November 12, 2026, the price of The Graph (GRT) in India is Rs.1.59 (about $0.0169). Over the last 24 hours GRT is down 4.19%.What is the 24-hour high and low of The Graph?
In the last 24 hours The Graph has traded between a low of Rs.1.59 ($0.0169) and a high of Rs.1.71 ($0.0182). At Rs.1.59, the current price sits at the lower end of that range.What is the highest and lowest price of The Graph since February 15, 2026?
Between February 15, 2026 and November 12, 2026, The Graph recorded a high of Rs.3.01 ($0.0314) on September 28, 2026 and a low of Rs.1.26 ($0.0132) on August 19, 2026. The current price of Rs.1.59 is 47.14% below that high and 26.16% above that low.How has the The Graph price moved over the last 10 days?
Over the last 10 days (November 03, 2026 to November 12, 2026) The Graph moved from Rs.1.83 to Rs.1.59, a decline of 13.19%. The price ranged between a low of Rs.1.59 and a high of Rs.1.94 over this period. It closed higher on 6 of the last 17 sessions.What is the market capitalisation of The Graph?
The Graph has a market capitalisation of Rs.1.76K Cr ($186.80M), which puts it at rank #125 among all cryptocurrencies tracked on GoodReturns. Its trading volume over the last 24 hours is Rs.132.81 Cr ($14.12M).How much has The Graph gained or lost over the last week, month and year?
The Graph is down 16.62% over the last 7 days, down 33.79% over 30 days and down 74.79% over the last one year.How many The Graph (GRT) coins are in circulation?
The Graph has a circulating supply of 11.04B GRT and no fixed maximum supply.Disclaimer: Cryptocurrency is an unregulated digital asset class in India and prices are highly volatile. This is third-party content/data; viewers are requested to use their discretion and conduct proper diligence before investing. GoodReturns does not take any liability on the genuineness and correctness of the information presented here.

 Sign in with Google