

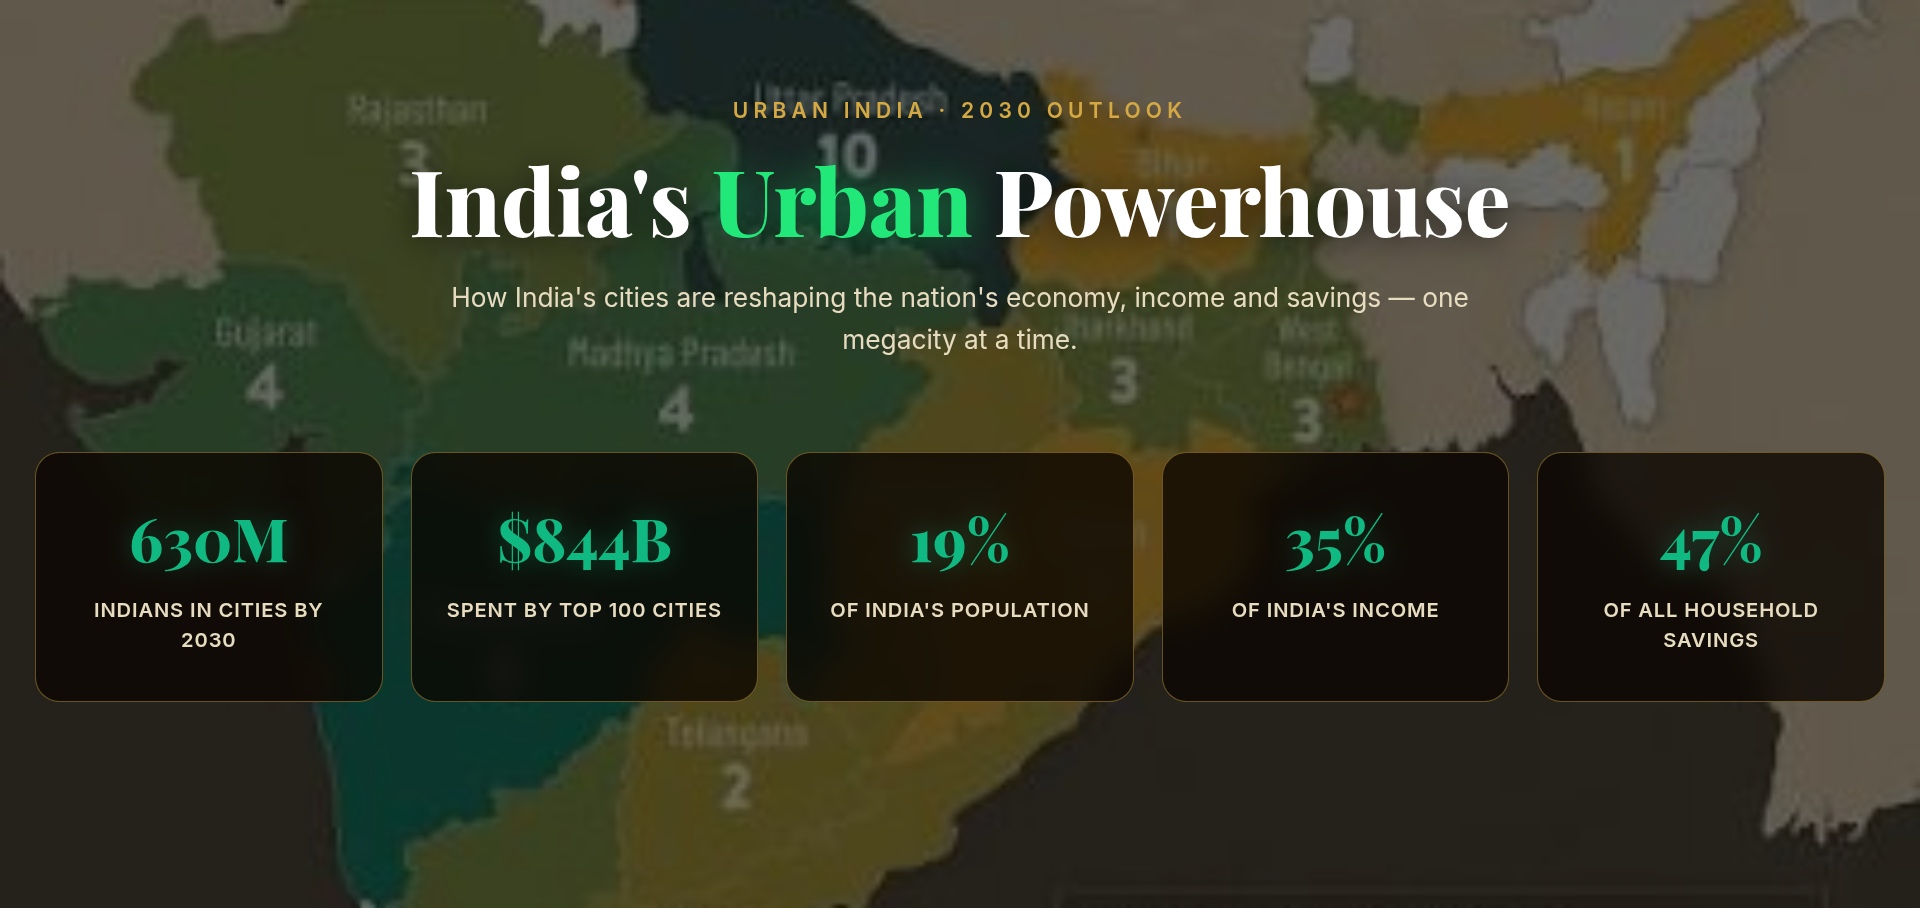
There is a version of India's urban economy that gets repeated constantly in investor presentations, policy documents, and marketing decks. It says: India is urbanising rapidly. The middle class is rising. Cities are driving growth. All of this is true - and almost all of it misses the point.
A new report from PRICE (People Research on India's Consumer Economy), produced in partnership with Tata Sons and drawing on the ICE 360° household survey - one of the largest of its kind, covering 100 cities and tracking actual incomes and spending across 282 million people - finally tells the story with real numbers. What it reveals is not one urban India, but four very different ones, each with a distinct financial personality, risk profile, and future trajectory.
/img/2026/07/india6-19831784014297.jpg "Urban India")
01 - The Asymmetry: Why This Data Matters
Start with the number that makes everything else make sense. India's top 100 cities hold just 19% of the country's population. But they account for 35% of its total income, 31% of all consumption - and a staggering 47% of all household surplus, the measure closest to actual savings.
/img/2026/07/100cities-30371784025378.jpg "100 cities")
02 - Four Urban Indias: The Tier Framework
The 100 cities divide cleanly into four groups. Understanding which tier a city belongs to tells you almost everything about its financial personality - how much households earn, how much they spend, how much they save, and how stretched they are.
/img/2026/07/4urban-79311784025439.jpg "4 urban")
Four Tiers - Key Household Metrics (2025-26)
| Indicator | Big Six | Boomtowns | Breakout | Frontier |
|---|---|---|---|---|
| Avg income (₹ lakh/yr) | ₹23.2L | ₹16.7L | ₹14.2L | ₹11.9L |
| Avg spending (₹ lakh/yr) | ₹13.5L | ₹12.2L | ₹11.2L | ₹9.1L |
| Avg savings (₹ lakh/yr) | ₹9.7L | ₹4.5L | ₹3.0L | ₹2.8L |
| Spends % of income | 58.3% | 73.1% | 78.6% | 76.1% |
| Saves % of income | 41.7% | 26.9% | 21.4% | 23.9% |
| Overstretched households | 6.0% | 10.7% | 13.3% | 15.0% |
| Health spend per household | ₹88,558 | ₹68,388 | ₹72,299 | ₹54,861 |
All figures 2025-26. 'Overstretched' = households that struggle to meet routine or unexpected costs. ₹1 lakh = ₹100,000.
The Big Six save 41.7% of their income. The Frontier cities save just 23.9% - and 1 in 6 Frontier households is financially overstretched at any given moment.
- ICE 360° Household Survey, PRICE & Tata Sons, 2025-26
03 - The Income Escalator: The Biggest Shift in a Generation
One decade ago, the middle-income household was a minority in urban India. Today it is the majority. By 2030-31, low-income urban India will have essentially ceased to exist as a meaningful economic category.
/img/2026/07/indiagreatincome-56931784025494.jpg "great")
04 - The League Table: The Richest City Is Not a Megacity
Per-household income in the six megacities is the highest in absolute terms. But the highest per-household income in India belongs to Kozhikode - a mid-sized city in Kerala - because of one factor that transforms everything: remittances from Gulf-based workers flowing back into relatively small households.
Hyderabad has the highest share of middle-income households of any city. Mumbai leads on the share of high-income households. Chennai earns less than Delhi on average - but carries the heaviest debt load of any megacity. Bengaluru, despite its reputation as a spending city, saves more proportionally than any of its megacity peers.
05 - The Spending Basket: Food Is Losing
The structure of what urban India buys is changing at pace. A decade ago, food accounted for roughly 38% of the urban household wallet. Today it is 31%. More than 70% of spending is now on non-food items - and within food itself, dairy and vegetables have overtaken cereals and pulses. The Indian plate has inverted.
Urban households will spend more on education and health combined this year - ₹8.4 lakh crore - than on all cereals, pulses, and cooking oil they consume. That is a structural shift with enormous implications for every consumer business targeting Indian cities.
Where the money goes - by tier (share of household spending)
| Category | Big Six | Boomtowns | Breakout | Frontier |
|---|---|---|---|---|
| Food & groceries | 28% | 32% | 34% | 36% |
| Housing & utilities | 22% | 19% | 18% | 17% |
| Transport | 14% | 13% | 12% | 11% |
| Education | 11% | 12% | 13% | 12% |
| Health | 7% | 8% | 9% | 10% |
| Clothing & personal | 9% | 8% | 8% | 8% |
| Leisure & other | 9% | 8% | 6% | 6% |
Approximate shares, 2025-26 estimates. Based on ICE 360° consumption data.
06 - The Weekend Economy: 62% of Spending in Two Days
One of the most striking findings in the entire dataset has nothing to do with income or savings - it is about timing. Urban India concentrates nearly two-thirds of its weekly spending into Saturday and Sunday. The richer the household, the more extreme the effect.
Jaipur is the most weekend-driven city in the country - with a weekend multiplier of 2.76, meaning households spend nearly three times as much on weekends as on weekdays. This is followed by Surat (2.44×), Pune (2.19×) and Kochi (2.04×). The outlier is Dhanbad, a mining city in Jharkhand, where the weekend multiplier is actually below 1 - making it the only city in India where weekdays are busier than weekends economically.
/img/2026/07/indiadebt-22521784025601.jpg "debt")
Debt is growing fastest not in the megacities but in the Breakout cities - at 15.2% a year. These are cities where incomes are rising fast enough to make large purchases feel achievable, but not yet fast enough to absorb the repayments comfortably.
08 - Health: The Smaller the City, the Heavier the Bill
The health data in this report contains one of the most striking inversions in the entire dataset. Frontier cities spend the fewest rupees on health in absolute terms - but the largest share of their income. They are also the tier with the best insurance coverage in the country, because government schemes reach them more effectively. Delhi and Mumbai, the richest cities in India, have among the worst health insurance coverage of any urban tier.
/img/2026/07/urbanindia-39181784025654.jpg "urban")
09 - Five Corridors: Cities That Grow Together
Cities do not grow in isolation. The report identifies five economic corridors - chains of cities that share industries, migration patterns, and consumer behaviour - and together account for a third of all urban spending.
/img/2026/07/2030-55271784025766.jpg "2030")
The "middle economy" - sub-metropolitan areas under 500,000 people within 50km of a larger city - is also quietly becoming a major force. These satellite towns already account for 20% of national consumption and 1 in 3 rupees of new household spending over the past decade. The urban-rural divide is dissolving at the edges in ways that aggregate data does not capture.
The cities that will generate the most new consumer spending over the next decade are not the ones making the most headlines. They are mid-sized, fast-growing, and sitting on the edge of the next income threshold - crossing the lines where households start buying cars, air conditioners, and washing machines for the first time.
- GoodReturns Wealth analysis based on PRICE / ICE 360° 2025-26 data


 Click it and Unblock the Notifications

 Sign in with Google