



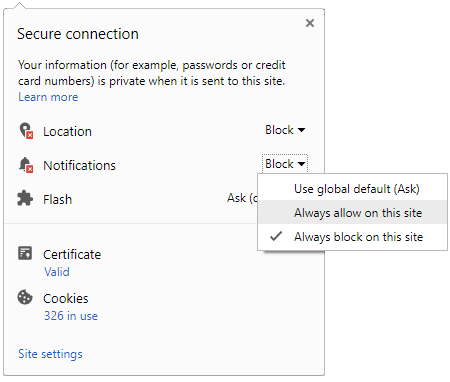
 Click it and Unblock the Notifications
SSMI
Switzerland
SMI Index (SSMI): SMI - (CFD)
14581.10
-16.53
(-0.11%)
▼
Updated On Oct 28, 2026
14581.10
Low
14489.92
High
14621.00
Prev. Day Close
14597.63
Low
14489.92
High
14621.00
SMI - (CFD) Index Futures Live Chart & Historical Data Graph
14581.10 -0.11%
Realtime Share Prices for Constituents of SMI
⌕
| Name | LTP | Change | High | Low | Close |
|---|---|---|---|---|---|
| Richemont | 164.10 | ▼ -0.03 | 165.25 | 162.70 | 164.15 |
| ABB | 72.88 | ▲ +1.93 | 73.38 | 71.88 | 71.50 |
| Holcim | 68.10 | ▲ +0.06 | 68.42 | 67.34 | 68.06 |
| Logitech | 82.02 | ▼ -10.81 | 86.00 | 80.54 | 91.96 |
| Zurich Insurance Group | 618.40 | ▲ +0.39 | 619.40 | 612.00 | 616.00 |
| Swiss Life Holding | 952.40 | ▲ +1.06 | 954.80 | 938.80 | 942.40 |
| Novartis | 129.22 | ▲ +0.34 | 130.86 | 128.04 | 129.22 |
| Nestle | 82.81 | ▼ -0.53 | 83.15 | 82.37 | 82.81 |
| Swiss Re | 150.10 | ▼ -0.92 | 150.95 | 149.60 | 151.50 |
| Roche Holding Participation | 398.80 | ▼ -0.05 | 400.30 | 392.50 | 399.00 |
| Lonza Group | 629.80 | ▼ -0.94 | 634.40 | 623.60 | 635.80 |
| Geberit | 570.20 | ▼ -1.11 | 575.60 | 568.20 | 576.60 |
| Sika | 176.20 | ▲ +0.54 | 177.05 | 174.30 | 175.25 |
| Partners Group | 644.40 | ▲ +1.38 | 646.40 | 632.40 | 635.60 |
| UBS Group | 38.60 | ▼ -0.62 | 38.70 | 37.56 | 38.84 |
| Givaudan | 3,914.00 | ▼ -0.76 | 3,939.00 | 3,857.00 | 3,944.00 |
| Alcon | 57.64 | ▲ +0.10 | 58.18 | 56.74 | 57.58 |
| Sandoz | 79.88 | ▼ -2.70 | 81.38 | 75.50 | 82.10 |
| Galderma | 185.20 | ▲ +0.11 | 187.35 | 184.75 | 185.20 |
| Amrize | 33.09 | ▼ -0.39 | 33.47 | 32.89 | 33.22 |
Disclaimer: This is 3rd Party content/feed, viewers are requested to use their discretion and conduct proper diligence before investing, GoodReturns does not take any liability on the genuineness and correctness of the information in this article

 Sign in with Google